Features

Everything MikroMind does

For the MikroTik routers, switches, and access points you deploy at subscriber homes and customer businesses. Every customer gets every feature — no tiered gating.

01

Auto-onboarding

Pre-configure a MikroTik in the office, ship it, plug it in. The device dials home, pulls its assigned customer template, applies the config, and shows up on the dashboard. No copy-pasting scripts by hand — and no inbound ports opened on the customer router.
02

Secure connectivity, zero holes

Every router gets its own WireGuard tunnel back to your MikroMind instance. Devices connect outbound, so hardware behind NAT or CGNAT is fully manageable — nothing inbound is ever opened on the customer's network. The RouterOS API, stats, syslog, and firmware transfers all ride the encrypted tunnel.

03

Templates & per-customer config

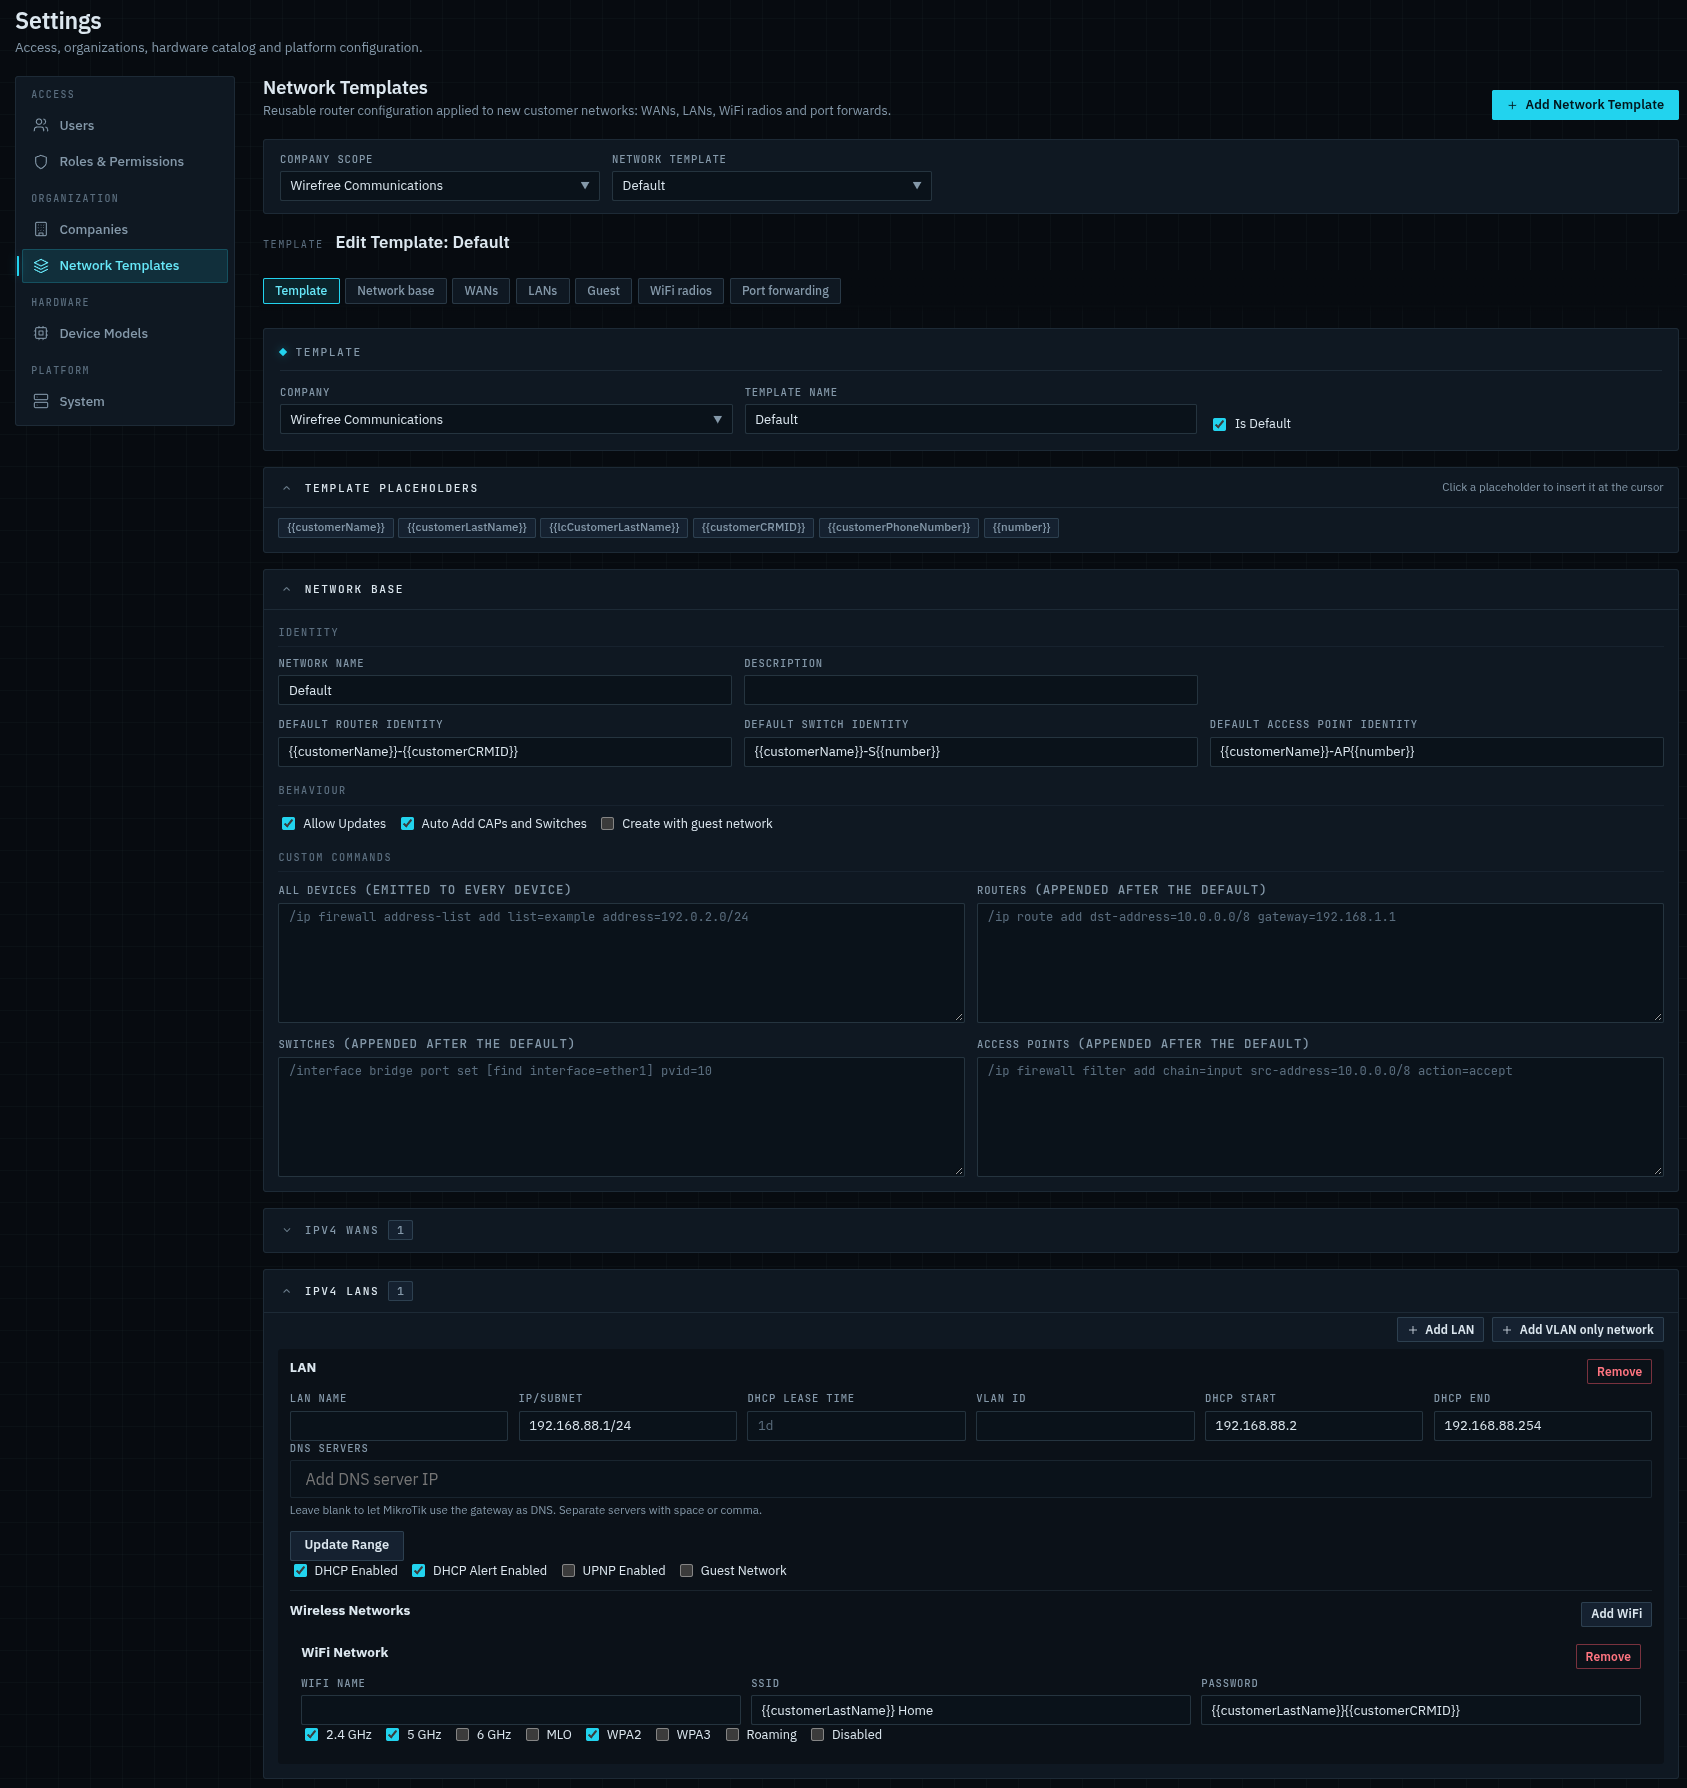
Define a base template once: WAN type, LAN settings, Wi-Fi SSIDs, port forwards, etc — and assign it to a company. Override only what varies per customer.

Network template editor: company-scoped placeholder fields, network base settings, custom RouterOS commands, WAN and LAN sections, and WiFi networks with SSID and password fields
The template editor. Placeholders like customerName and the CRM ID fill in per customer, so one template configures every site it's assigned to — click to enlarge.
04

Fleet dashboard

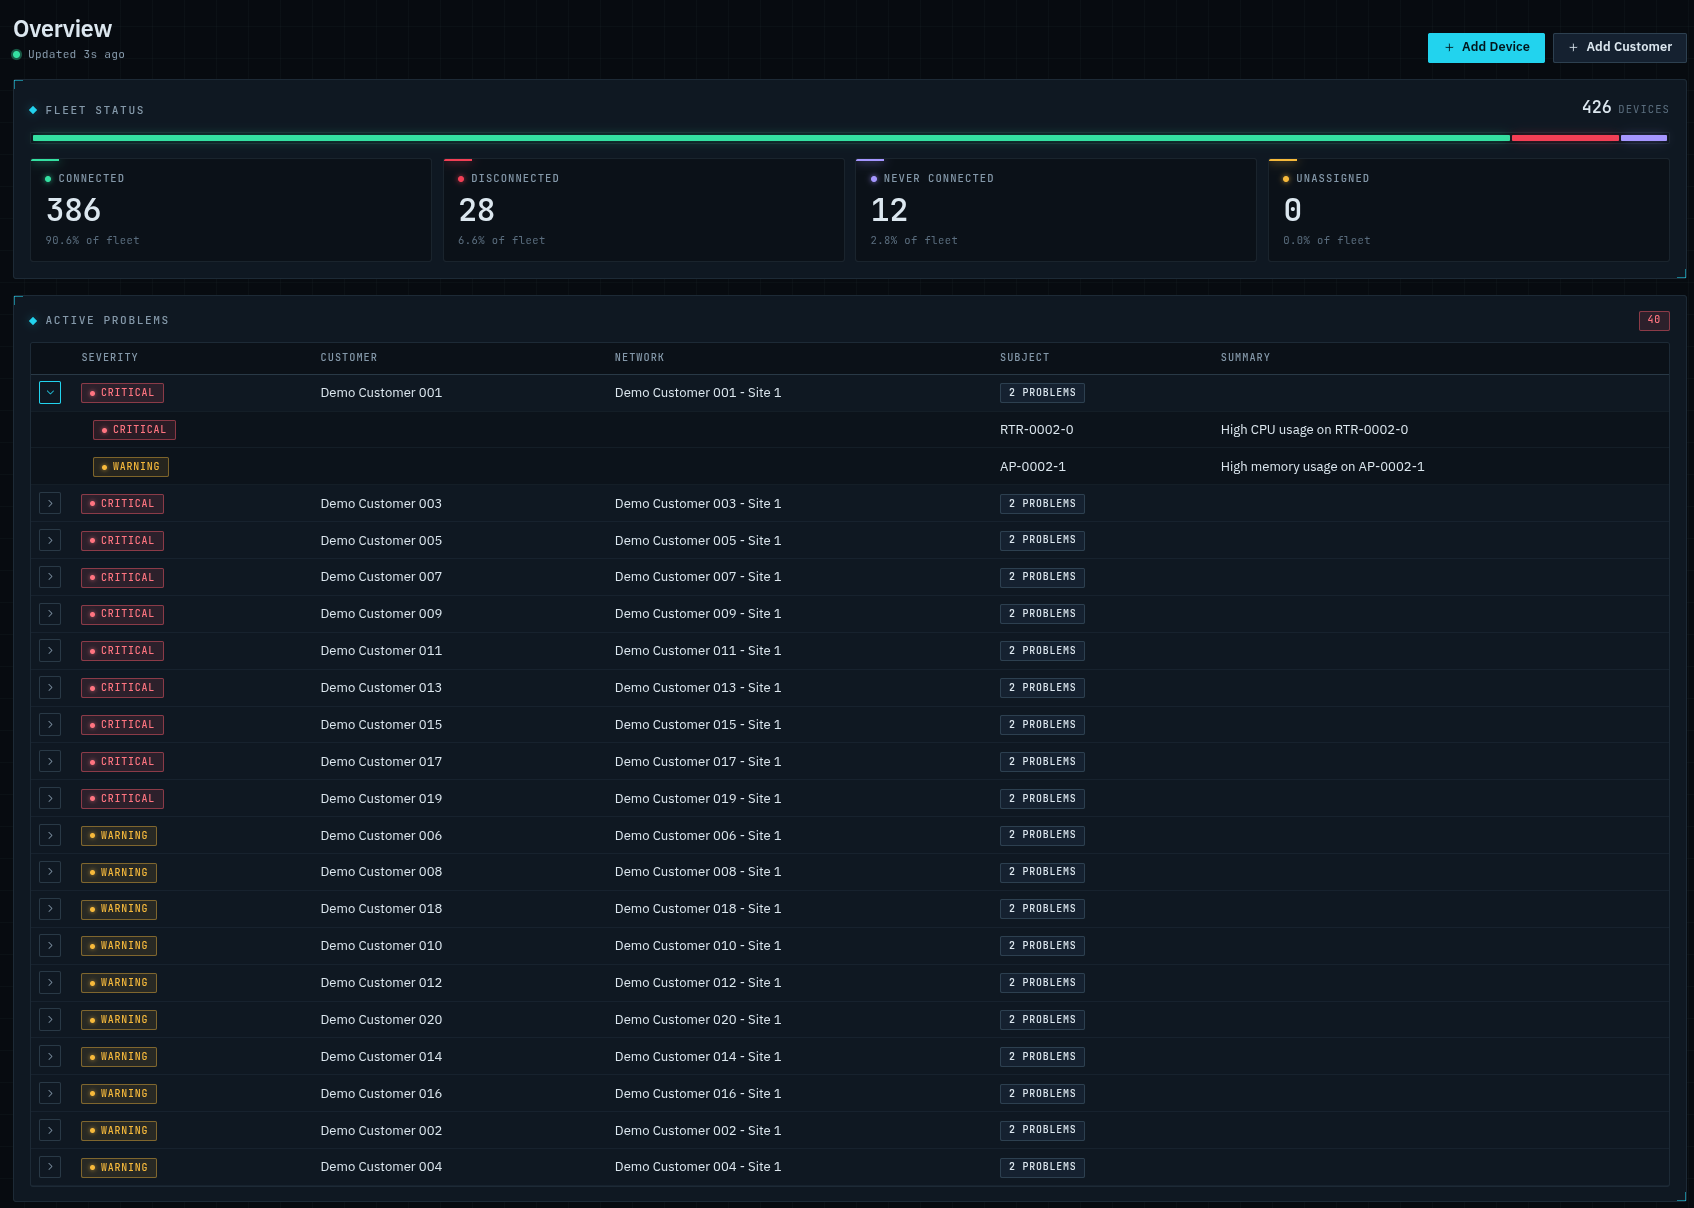
Connected, disconnected, never-connected, and unassigned summary cards, with an active problems panel below. Drill into any card for a filtered, sortable device list with live metrics.

Fleet overview dashboard: connected, disconnected, never-connected, and unassigned totals, with an active problems table listing severity, customer, network, and summary
The Overview dashboard: fleet status up top, every active problem with severity and customer below — click to enlarge.
05

Time-series metrics

CPU, RAM, temperature, wireless signal, per-interface throughput, SFP RX power, and ping latency — collected continuously and charted over the time range you care about, with live streams for troubleshooting.

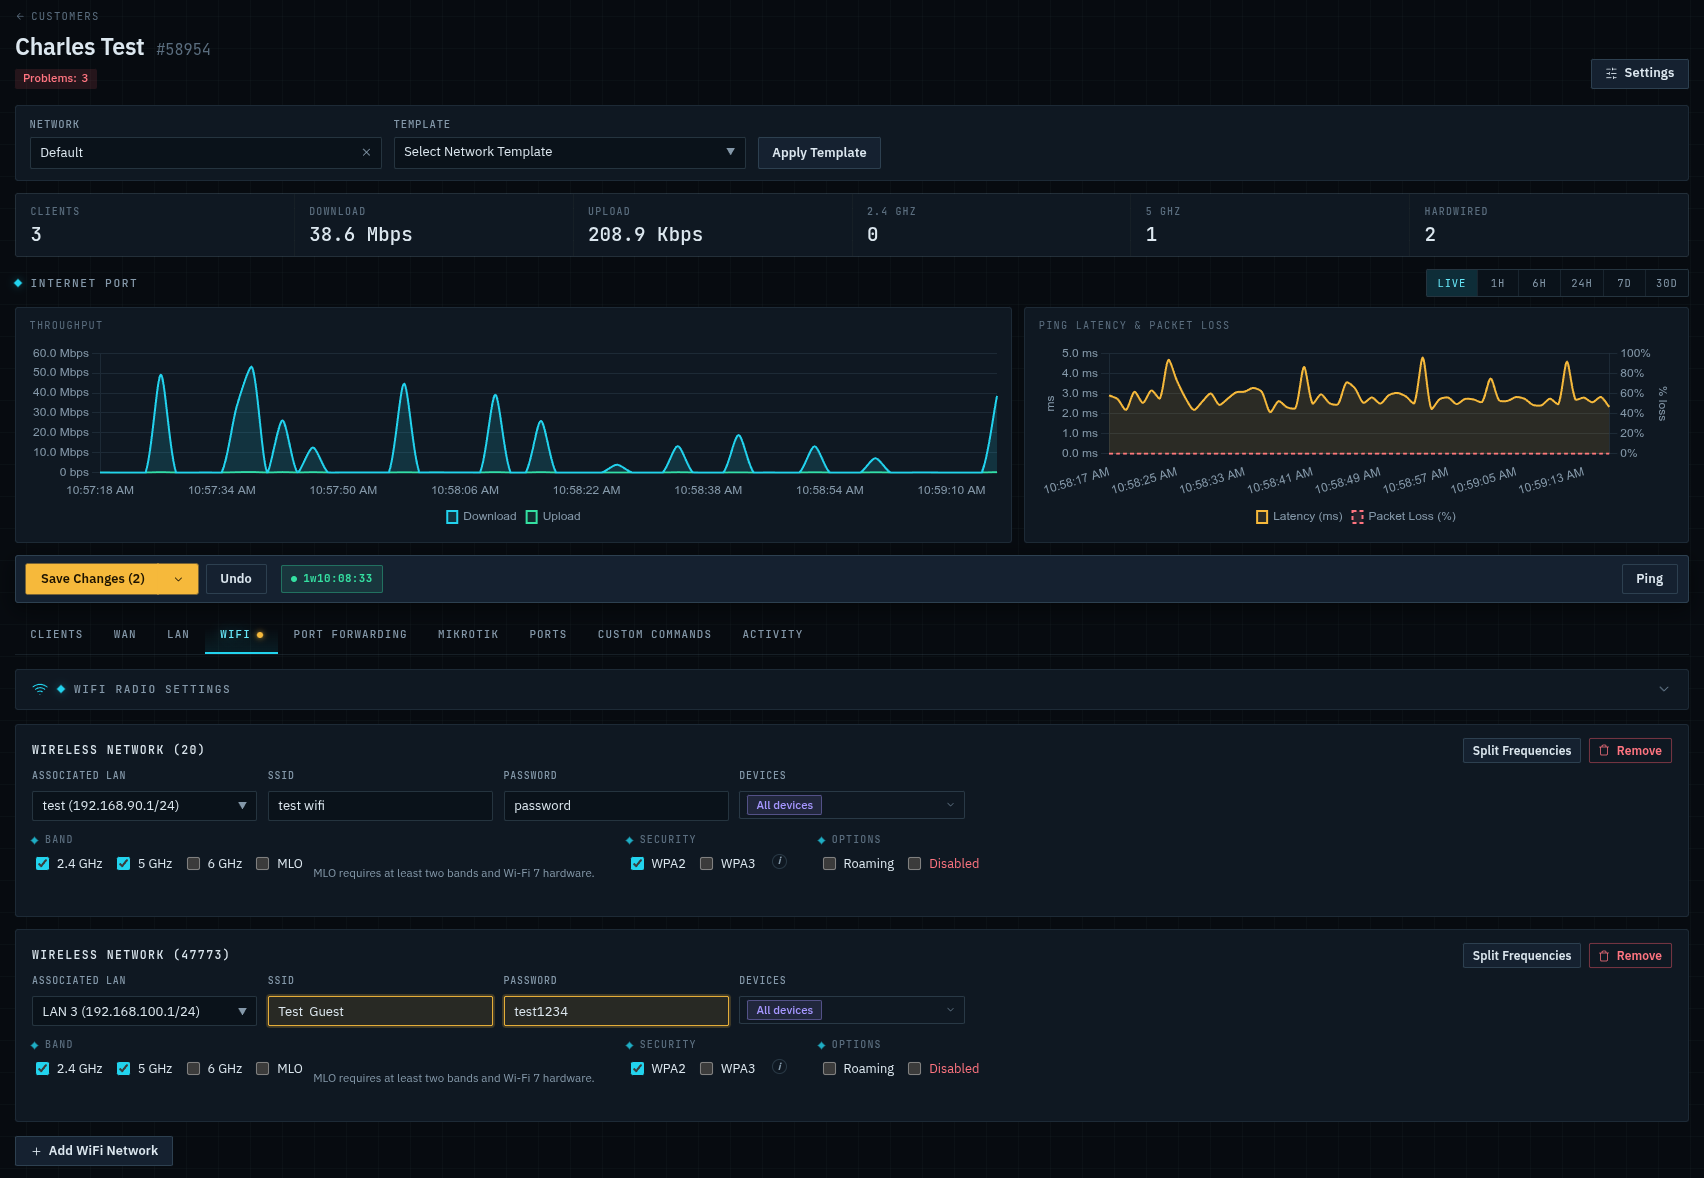
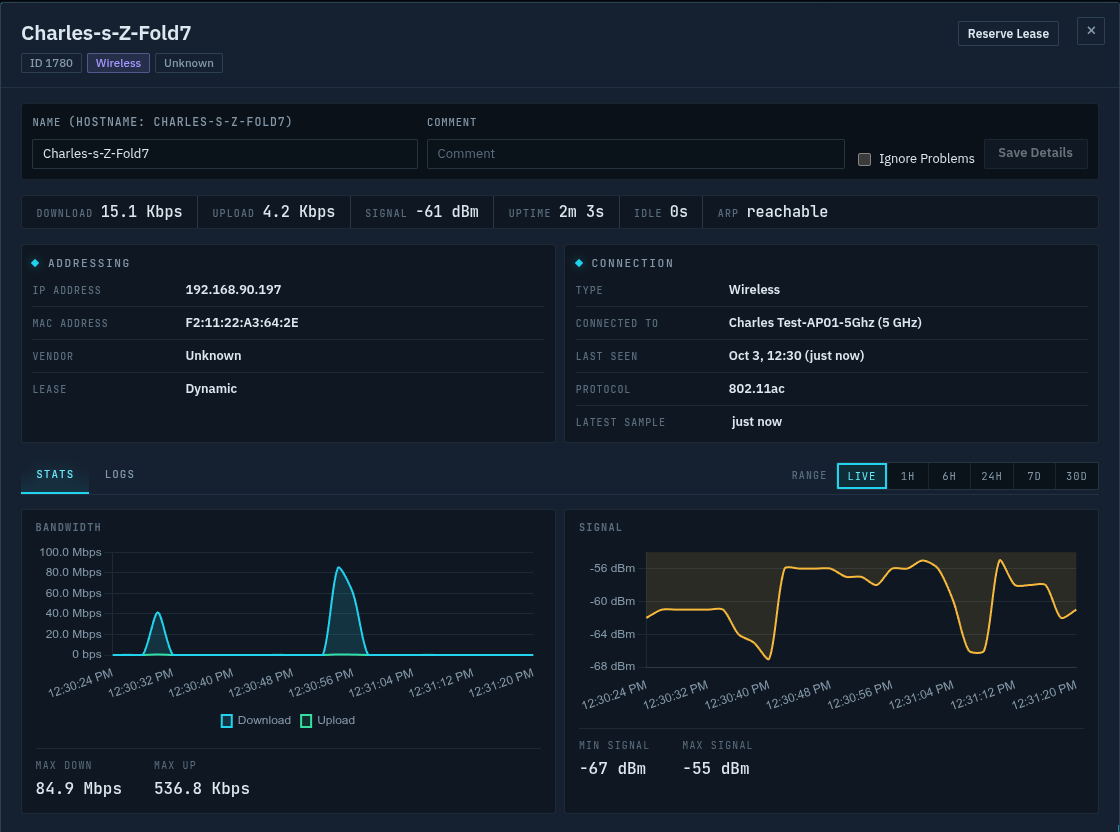
Customer detail page: live throughput and ping latency charts, and Wi-Fi radio settings with SSID and password fields beside Save Changes and Undo buttons Wireless client detail: addressing and connection info with live bandwidth and signal-strength charts
One customer's site: live internet-port charts next to the settings tier-1 staff can safely change (SSID, Wi-Fi password) with save and undo. Right: drill into a single wireless client's signal and bandwidth. Click either to enlarge.
06

Ping monitoring

Continuous ICMP probes track latency, packet loss, and jitter for every device, with full history and live views — so you see a flapping link before the customer calls it in.

07

Built-in speed tests

Run RouterOS bandwidth tests against a device on demand, keep the history, and capture WAN usage alongside it. No separate tooling needed.

08

Scheduled changes & maintenance windows

Push config changes now, at an exact time, or in your next maintenance window (e.g. 3 AM–5 AM). You can also push changes for offline devices, and they'll get them when they come online.

09

Firmware management

Set target firmware per company or per network. Rollouts run in batches inside your maintenance window and verify each device comes back online — and its wireless clients reconnect — before continuing. A stuck or failed device pauses the rollout instead of ruining your morning.

10

Activity log with 1-click revert

Every network-settings change is saved with a field-level before/after diff. Revert on any entry pushes the prior configuration back to the device.

11

Problem detection

A focused set of detector types: WAN links negotiated below 10 Mbps, degraded link speeds, rogue DHCP servers, weak wireless signals, high CPU or RAM, ethernet health, port and Wi-Fi interface errors, and PoE supply faults. Thresholds are configurable per company, and individual issues can be ignored per client device, MikroTik, or network.

12

Splynx sync

Customers, internet services, and devices sync from Splynx on your schedule. Conflicts are flagged for review — never silently overwritten.

13

Bridge-host topology discovery

Bridge-host MAC observations build a logical diagram of how customer routers, switches, and APs connect — down to which port a client device hangs off.

14

Custom RouterOS CLI

For configs outside the standard UI fields, senior techs can add raw RouterOS CLI commands. Custom commands survive factory resets and re-apply on every sync.

15

Syslog collection

A built-in syslog server receives and structures logs from across the fleet, searchable by device and interface.

16

Switch-port power tools

Monitor and control PoE output per port with power telemetry, run ethernet cable tests, enable/disable or flap ports, and assign per-port VLANs from the UI.

17

Built-in support tickets

File a support ticket right from inside the app. It automatically captures the page you were on and recent errors, so we can reproduce what you saw.

…plus 7 more operational features, all included

  • Global search across customers, networks, devices, and MACs
  • CSV import for customers and devices
  • NTP server management built in
  • IP allowlisting for public endpoints (onboarding, firmware)
  • Self-update of the server binary
  • UniFi AP adoption helper (DHCP option 43)
  • Device model catalog with per-device overrides

Ready to see it on your fleet?

Start a cloud account or click around the demo first. No credit card needed.